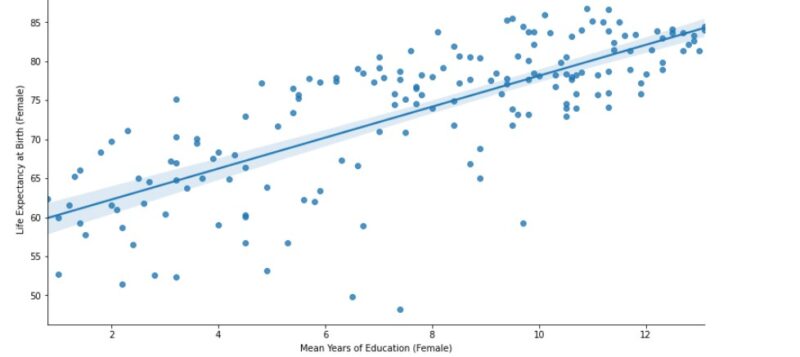
The analysis/visualization project will consist of a report built around a visualization in response to a specific question in context. You’ll create the question, but we’ll treat the question as if it comes from a client. As analysts, your job will be to identify the context of the question in order to make a case for a specific insight that would result from analyzing the question in context. The goal is to make a case for the important things would we learn from visualizing relevant data related to the question. The visualization will be a kind of dashboard or infographic: a series of graphs with a narrative to explain them. The visualization will be part of a report that explains the context and connects the insights from the visualization to related material–that is, academic literature, prior reports, media narratives, etc.
The Proposal
In the proposal, you will identify the question and then describe the context. This will be written as a persuasive argument about the value of the insights to be gained from the analysis. In other words, why do we need to know this?
The structure of the proposal is as follows:
A. Introductory paragraph in which the question (from the client) is identified in context.
B. A description of a data source (or sources) that can be used to answer the question. This will include considerations about data quality (methods, validity, reliability).
C. A plan, with benchmarks, for delivery of the analytical report.
The Report
The visualization and report will be due at the end of the semester. The structure of the report will be as follows:
A. Introduction
B. Brief description of the data
C. Visualization + narrative (dashboard)
D. Summary of the insights gained from the data
E. Connections to existing knowledge
Parts D and E should not be more than 6 paragraphs in total. The grading rubric for the report will emphasize the quality of the logic of your analysis.
The Presentation
At the end of the semester, each analyst (or team) will present their visualization and narrative to the class. Each presentation will be 10-12 minutes, including time for a few questions and answers. You can use any delivery method you wish (Powerpoint, Sway, Tableau story, slides, etc.) but the focus should be on showing the visualizations and interpreting them in a concise and persuasive way. The grading rubric for the presentation will emphasize this.


